
Graphing equations is a fundamental skill in mathematics that helps visualize relationships between variables. Whether you are working on linear equations, quadratic functions, or more complex algebraic expressions, understanding how to graph equations allows you to interpret solutions, analyze trends, and solve real-world problems. For students, engineers, and anyone learning math, mastering this skill opens the door to more advanced topics in calculus, statistics, and physics.
Graphing transforms abstract numbers into visual representations, making concepts easier to comprehend. By plotting points, drawing lines, or using curves, you can see how changes in variables affect the outcome. This guide covers multiple methods for graphing, including manual plotting, using slope-intercept form, and digital tools. It also provides practical tips to avoid common mistakes while enhancing accuracy and clarity.
Understanding the Basics of Graphing Equations
Before learning how to graph equations, it is essential to understand the coordinate system. The Cartesian plane consists of two perpendicular lines: the x-axis (horizontal) and the y-axis (vertical). The point where these axes intersect is called the origin, represented as (0, 0). Each point on the plane is defined by an ordered pair (x, y), indicating its horizontal and vertical positions.
Graphing an equation involves plotting all points (x, y) that satisfy the given relationship. Equations can be linear, producing straight lines, or nonlinear, forming curves such as parabolas, circles, or hyperbolas. Understanding how to graph equations the type of equation is crucial because it determines the method and tools used for graphing. Mastery of the basics ensures smoother transitions to more complex functions.
Types of Equations You Can Graph
Equations come in various forms, and each requires a slightly different approach when graphing. The most common types include linear, quadratic, cubic, and exponential equations. Linear equations follow the format y = mx + b, producing straight lines. Quadratic equations, like y = ax² + bx + c, produce parabolas. Cubic equations generate S-shaped curves, while exponential equations grow or decay rapidly depending on the base.

Each type has unique characteristics. For example, linear equations have a constant slope, whereas quadratic equations have a vertex representing the minimum or maximum point. Recognizing the equation type allows you to anticipate its graph shape, making plotting faster and more accurate. Understanding how to graph equations, these distinctions is the foundation for more advanced graphing skills.
Preparing to Graph Equations
Before plotting, gather the necessary tools. You need graph paper or a digital graphing tool, a ruler, and a calculator for complex calculations. Label the axes clearly, including the origin and appropriate scales. Choosing consistent intervals ensures that your graph is proportionate and visually accurate.
Next, identify the type of equation and simplify it if necessary. For linear equations, solving for y in terms of x often makes graphing easier. For quadratics or higher-degree equations, calculate key points such as the vertex, axis of symmetry, and intercepts. How to graph equations, Proper preparation reduces errors and ensures a smooth graphing process.
How to Graph Linear Equations
Linear equations are the simplest to graph. They represent straight lines on the Cartesian plane. Start with the slope-intercept form: y = mx + b, where m is the slope and b is the y-intercept. The slope determines how steep the line is, while the y-intercept indicates where the line crosses the y-axis.
Begin by plotting the y-intercept on the vertical axis. Use the slope to determine the next point by moving up or down and left or right according to the rise-over-run rule. Draw a straight line through these points, extending in both directions. Label the line with its equation for clarity. How to graph equations, this method ensures accuracy and a clear visual representation.
Graphing Quadratic Equations
How to graph equations? Quadratic equations form parabolas and follow the standard form y = ax² + bx + c. To graph a parabola, identify key elements such as the vertex, axis of symmetry, and y-intercept. The vertex can be found using the formula x = -b / 2a, and substituting this value into the equation gives the y-coordinate.
Plot the vertex and y-intercept first. Then, select additional x-values on either side of the vertex, calculate corresponding y-values, and plot these points. Finally, draw a smooth curve connecting all points, forming a parabola. Quadratic graphs are symmetric, so ensure both sides of the vertex mirror each other. This approach provides an accurate visual representation.
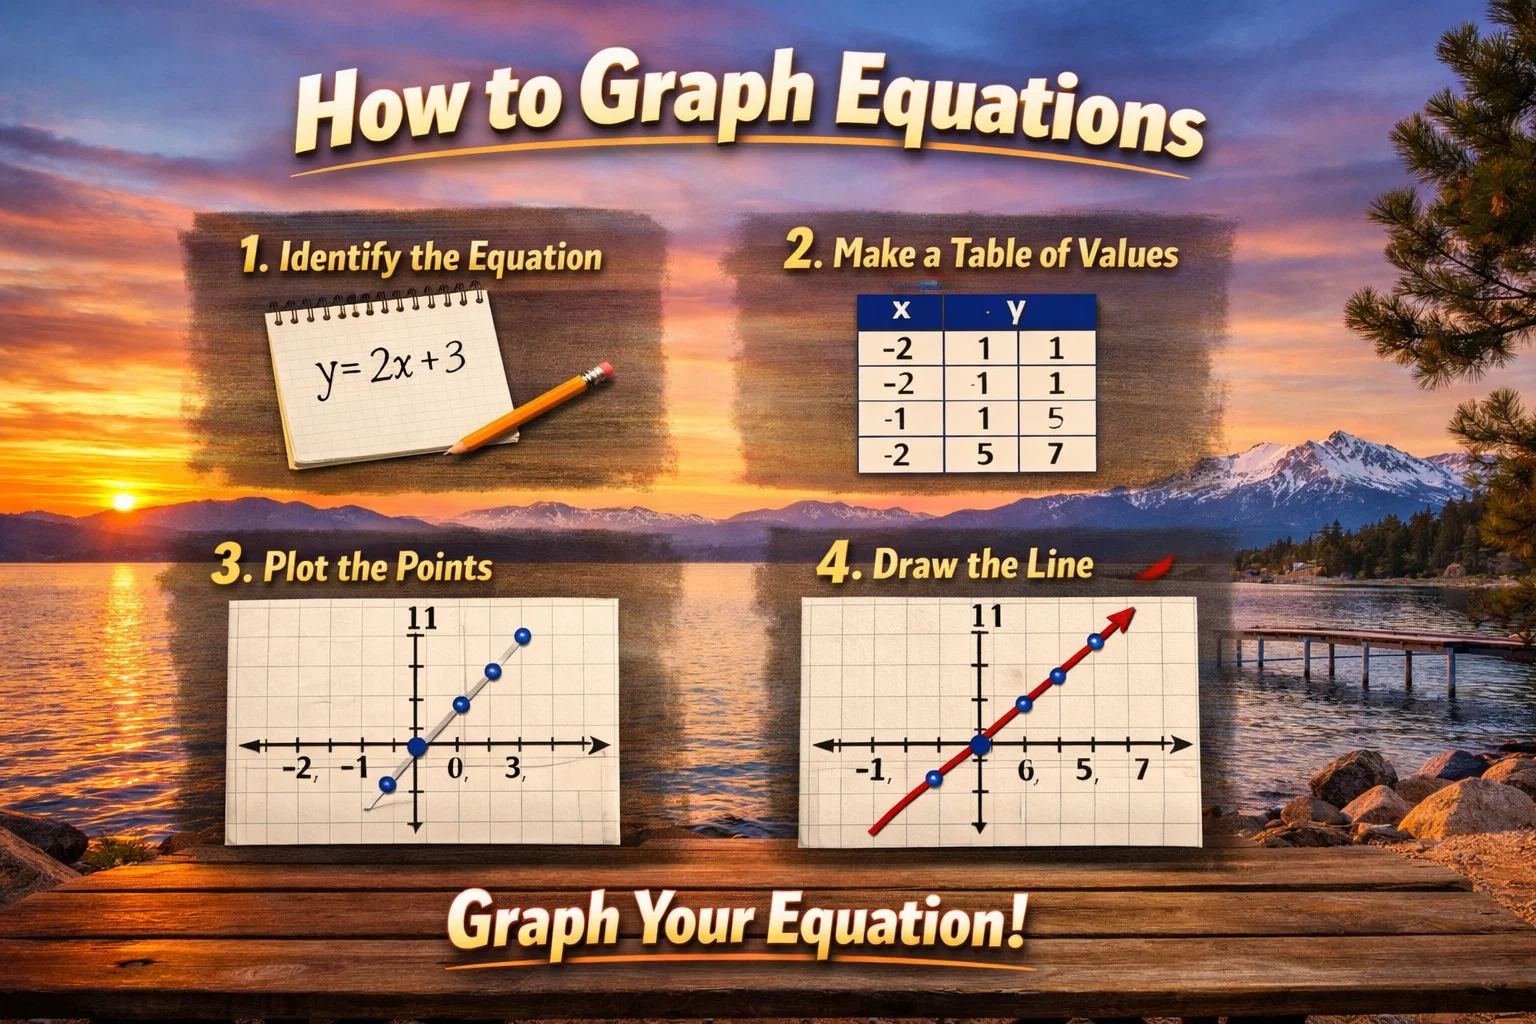
Plotting Points Manually
Plotting points manually is effective for all types of equations. Create a table of values by selecting x-values and solving for corresponding y-values. For example, if graphing y = 2x + 1, choose x-values such as -2, -1, 0, 1, and 2. Solve the equation to get y-values and record the ordered pairs.
Once how to graph equations the table is complete, plot each point on the Cartesian plane. Connect the points with a line or curve, depending on the equation type. Manual plotting is an excellent way to understand how equations behave and how changing variables affect the graph. It also reinforces fundamental algebraic skills.
Using Intercepts to Graph Equations
Intercepts provide quick reference points for graphing. The x-intercept is where the graph crosses the x-axis (y=0), and the y-intercept is where it crosses the y-axis (x=0). For linear equations, these points are often sufficient to draw the line accurately.
To find intercepts, set y=0 to find the x-intercept and set x=0 to find the y-intercept. Plot these points on the graph and draw the line connecting them. Using intercepts is especially useful when speed is important, such as during exams or homework assignments. How to graph equations this method works for linear, quadratic, and some higher-degree equations.
Graphing with Slope
Slope is a crucial concept in graphing linear equations. It represents the rate of change between x and y and is calculated as rise over run (Δy/Δx). Positive slopes rise to the right, negative slopes descend, and zero slopes produce horizontal lines.
When graphing using slope, start from a known point, usually the y-intercept. Apply the slope by moving vertically (rise) and horizontally (run) to plot additional points. Connect these points with a straight line, extending in both directions. Understanding how to graph equations slope ensures precision and helps predict the graph’s behavior intuitively.
Graphing Using Transformations
How to graph equations? For more advanced equations, transformations simplify graphing. Shifts, stretches, and reflections modify the base graph of a function without recalculating every point. For example, in y = (x-3)² + 2, the parabola shifts 3 units right and 2 units up from the origin.
Transformations allow you to start with a familiar graph, like y = x² for quadratics, and adjust it according to the equation. This method saves time and provides insight into how algebraic changes affect graphical representations. It is widely used in precalculus and calculus courses.
Using Graphing Calculators and Tools
Graphing calculators and online tools simplify the process of plotting equations. Devices like the TI-84, or apps like Desmos and GeoGebra, allow you to input equations and view accurate graphs instantly.
How to graph equations? These tools are especially helpful for complex equations, multiple functions, or large datasets. They provide options to zoom, adjust scales, and customize graphs with labels, colors, and gridlines. While manual graphing builds foundational skills, digital tools enhance efficiency and visual clarity for students and professionals alike.
Common Mistakes When Graphing Equations
Even experienced students make mistakes when graphing. Common errors include mislabeling axes, plotting points inaccurately, using inconsistent scales, and misinterpreting slopes or intercepts. Failing to calculate key points like vertices or intercepts leads to distorted graphs.
How to graph equations? Avoid these mistakes by double-checking calculations, drawing neat axes, and using consistent intervals. When using digital tools, verify that the equation is entered correctly. Careful attention to detail ensures accurate graphs, which are crucial for understanding and interpreting mathematical relationships.
Interpreting Graphs
Graphing is not just about drawing; it’s also about analysis. Once how to graph equations a graph is complete, you can interpret its meaning. For linear equations, the slope indicates rate of change, while intercepts indicate starting points. Quadratic graphs reveal maximum or minimum values and symmetry.
Graphs help solve equations visually by identifying points of intersection. They also illustrate real-world relationships, such as speed over time, cost analysis, or population growth. Developing skills in interpreting graphs enhances both problem-solving and critical thinking.
Applications of Graphing Equations
How to graph equations? Graphing equations has broad applications across academics, science, and business. In physics, graphs depict motion, acceleration, and force relationships. In economics, they illustrate demand, supply, and cost functions. Engineers use graphs for design analysis, while students use them to solve algebraic and calculus problems.
Understanding how to graph equations provides a visual foundation for modeling, predicting, and analyzing real-world phenomena. The ability to translate equations into graphs bridges theoretical mathematics and practical applications, making this skill indispensable.
Practice Tips for Mastery
Consistency is key to mastering graphing. Practice plotting various types of equations manually and using digital tools. Start with simple linear equations, then move to quadratic, cubic, and higher-degree functions.
How to graph equations? Keep a notebook with tables of values, sketches, and notes on transformations. Review common mistakes and analyze previous errors. By combining manual and digital graphing methods, you develop intuition for equations and strengthen analytical skills. Regular practice ensures accuracy, efficiency, and confidence.
Conclusion
Learning how to graph equations equips students and professionals with essential mathematical tools. From linear and quadratic equations to complex functions, graphing transforms abstract algebra into visual insights. Understanding axes, slopes, intercepts, and transformations ensures accurate and meaningful representations.
How to graph equations? Whether plotting manually, using a calculator, or leveraging online tools, mastering graphing provides clarity, aids problem-solving, and reveals patterns hidden in numbers. Regular practice, attention to detail, and analysis of results ensure competence and confidence. Graphing is not just an academic skill; it is a gateway to interpreting and understanding real-world relationships.
Frequently Asked Questions
1. What is the easiest way to graph an equation?
The easiest way is to identify intercepts and plot them, then draw the line or curve connecting these points.
2. Can I graph nonlinear equations manually?
Yes, by creating a table of values and plotting points, then drawing a smooth curve to connect them.
3. How do I find the vertex of a quadratic graph?
Use the formula x = -b / 2a to find the x-coordinate, then substitute it into the equation to find y.
4. Is graphing calculators necessary for all equations?
Not always, but they simplify complex equations, save time, and improve accuracy for higher-degree functions.
5. What does the slope represent in a graph?
Slope represents the rate of change of y with respect to x, indicating how steep the line is.
6. Can I graph multiple equations on the same plane?
Yes, plotting multiple equations helps find intersections and compare relationships visually.
7. Why is scale important in graphing?
Consistent scale ensures accurate representation of relationships and prevents distortion of data or functions.
For More Update and Stories Visit Daily Guides